We have officially entered the era of the “skimmer.” In a digital landscape where the average person scrolls through roughly 300 feet of content every single day, the traditional, text-heavy blog post is facing a steep uphill battle. It’s not that people have stopped wanting to learn; it’s that they have stopped having the patience to dig for the “why” buried under paragraphs of preamble. When we are met with a wall of text, our brains often register it as a chore. However, when that same information is broken down into a vibrant, structured visual, our cognitive load drops, and our engagement spikes.
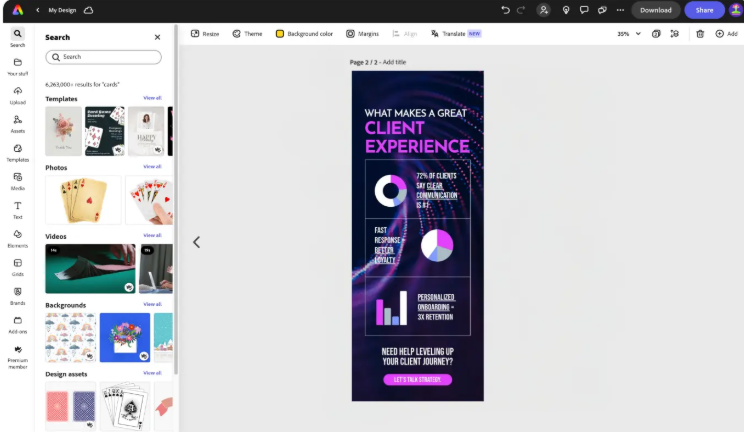
This shift toward visual-first communication isn’t just a trend for social media influencers; it is a fundamental requirement for anyone trying to establish authority in a crowded niche. Whether you are a small business owner explaining a complex service or a student presenting a thesis, your goal is to make the “aha!” moment happen as quickly as possible. To bridge the gap between raw data and a memorable narrative, you can design a custom infographic from Adobe Express to stand out and turn a dry list of facts into a shareable asset that people actually want to save. By moving away from the “tell” and embracing the “show,” you transform your brand from just another voice in the noise to a visual leader that respects the reader’s time.
The Science Behind the “Visual Hook”
Why does our brain prioritize images over text? It’s estimated that we process visuals 60,000 times faster than written words. While text is sequential—requiring us to process one letter and word at a time, a visual is holistic. We can grasp the relationship between two data points, the hierarchy of a process, or the “vibe” of a brand in a single glance.
In marketing, this is known as “pattern interruption.” While everyone else is posting standard stock photos or long-form captions, a well-structured graphic stands out because it promises immediate value. It says to the viewer: “I have already done the hard work of organizing this information for you. Just look here.”
3 Pillars of a High-Impact Infographic
Creating a visual that actually converts requires more than just dragging and dropping icons. If you want your content to have a professional edge, focus on these three structural pillars:
1. A Linear Narrative Flow
The biggest mistake in visual design is “The Scatterbrain Effect,” where icons and text are placed randomly around the page. A great graphic should guide the eye. Whether you are using a timeline, a step-by-step process, or a comparison layout, ensure there is a clear beginning, middle, and end. Use arrows, lines, or numbered headers to act as a roadmap for the reader’s eyes.
2. The Power of “Micro-Copy”
In an infographic, every word must earn its place. Replace long sentences with “micro-copy”, punchy, three-to-five-word headers that summarize the point. If you find yourself writing a paragraph inside a bubble, you’ve probably lost the “visual” part of the visual. Use the text to provide context, and let the icons or charts provide the “weight.”
3. Color Hierarchy for Clarity
Don’t just use colors because they look good together; use them to create focus. If you are highlighting a “Success vs. Failure” comparison, use a bold, contrasting color for the success side to draw immediate attention. Muted tones work best for secondary information, while bright, high-contrast colors should be reserved for your most important statistics or your final “Call to Action.”
Real-World Use Cases: Moving Beyond the “Fact Sheet”
How do you actually use these visuals to grow your brand or project? Here are a few actionable ways to integrate graphics into your current strategy:
- The “How-To” Guide: If your business involves a complex process (like a skincare routine, a software installation, or a recipe), a visual step-by-step guide is infinitely more shareable than a numbered list.
- The Industry Comparison: Position yourself as an expert by comparing “Old Way vs. New Way.” This highlights your unique value proposition without sounding like a “sales pitch.”
- The “Year in Review”: For nonprofits or small businesses, showing your impact through a “By the Numbers” graphic builds immense trust and transparency with your community.
- LinkedIn Leadership: Turn your latest professional insight into a “Cheat Sheet.” These are currently some of the highest-performing content types on professional networks because they offer “snackable” expertise.
Actionable Tips for a Professional Finish
Before you hit “publish,” run through this quick checklist to ensure your work looks like it came from a top-tier design studio:
- Check Your Alignment: Ensure your icons and text boxes are perfectly aligned. Human eyes are incredibly sensitive to things being “just a little bit off,” which can subconsciously signal a lack of professionalism.
- Whitespace is Your Friend: Don’t be afraid of empty space. If every inch of your graphic is filled with “stuff,” it will feel claustrophobic and difficult to read.
- Use High-Quality Icons: Avoid mismatched icon styles. If one icon is a “line art” style and another is a “solid 3D” style, the graphic will feel disjointed. Pick a theme and stick to it.
- Legibility Over Artistry: A font might look beautiful and “curly,” but if no one can read it on a mobile screen, it’s a failure. Stick to clean, sans-serif fonts for the bulk of your information.
The Future of Content is Visual
We are moving toward a world where “clarity” is the ultimate luxury. As AI-generated text floods the internet, the human ability to curate, organize, and visually present ideas becomes more valuable than ever. By taking the time to turn your insights into a structured visual format, you aren’t just making a “pretty picture”, you are providing a service to your audience.
You are giving them back their time, simplifying their learning process, and proving that you are an authority worth following. The tools are more accessible than they have ever been; the only thing left is for you to decide which story you want to tell.
Would you like me to help you brainstorm a specific layout or a set of icons that would best represent your current project’s data?